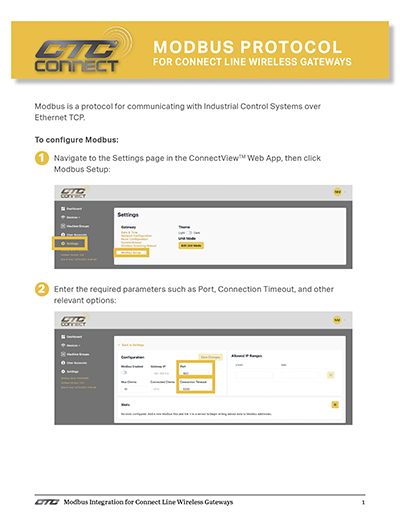
ConnectView Web App demo covering login, dashboard, device management, machine groups, user accounts, and settings. To log in, enter your email and password and click Log In. After login, the Dashboard displays automatically. The dashboard shows alerts, which can be filtered using checkboxes, with options to View or Acknowledge individual alerts. Trend data appears on the dashboard with selectable data output formats. Clicking a trend shows details. Devices marked as favorites appear on the dashboard and can be clicked to view details and edit settings. Under Devices, the Gateways section lists all gateways. Clicking a gateway shows its Primary or Secondary Status, Connection Status, Serial Number, and Available SD Card Storage. The gateway name is editable via a pencil button. Each gateway has two independent Bluetooth radio controllers. Controllers operate in series: Controller 1 scans, then Controller 2 scans, alternating. The active controller is labeled Scanning. For Cassia gateways, Controller 1 corresponds to the BT0 antenna and Controller 2 to BT1. Sensor capacity is editable. Sensors can be added to or removed from an Allow List or Deny List. The Wireless Sensors section includes Process Control Sensors and Dynamic Sensors. WS100 Series sensors appear under Process Control Sensors. Clicking a sensor shows Sensor Name, Serial Number, Part Number, Firmware Version, Gateway ID, Signal Strength, and Remaining Battery Life. Sensors can be added to or removed from favorites, renamed, or deleted. Deletion options include Delete Everything or Delete Data Only. Configurable settings for WS100 sensors are limited to Critical Alert and Early Alert thresholds. Reading Interval, Dynamic Range, Operation Mode, and Frequency Range are factory configured and not editable. If a sensor is assigned to a machine group, the group name displays on the sensor page. Alerts are displayed with checkbox filters by type. The most recent measurement displays automatically. Previous measurements are accessible by selecting a date and a specific reading from a dropdown. Trended data can be viewed by specifying start and end dates, data output format, and axis, then calculating. Dynamic Sensors (WS200 or WS300) display the same basic sensor information as Process Control Sensors. Additional capabilities include disconnecting a sensor, force connecting a sensor (only available in standby state), adjusting units between Velocity and Acceleration, and taking on-demand readings. Editable settings include Critical Alert, Early Alert, Reading Interval, Dynamic Range, and Reading Options (Frequency Range, FFT Resolution, Coupling). Alerts can be acknowledged individually or cleared all at once. Temperature readings can be viewed, taken on demand, filtered by date range, and exported to Excel. Measurement data can be filtered by date and time range. Measurements display with FFT chart data selectable by frequency unit and output unit, with axis views for X, Y, and Z, and frequency range presets. FFT chart data can be exported. Waveform data from a selected measurement is also displayed with X, Y, Z axis selection and exportable to Excel. Trended data is available with selectable output unit, date range, data format, and axis. All sensors can also be viewed in a flat list format showing both Process Control and Dynamic Signal sensors. Sensors in list view cannot be clicked to open individual sensor pages. List columns are sortable by heading. To view individual sensors, return to the Wireless Sensors landing page using the Group by Type button. Machine Groups allow sensors to be organized together. New machine groups are created with a name and saved. Sensors are added to a group by selecting sensor type and individual serial numbers. Multiple sensors can be added before submitting. Within a machine group, readings can be triggered from all assigned sensors simultaneously. Reading status and any resulting alerts display after completion, including a disconnected notice for sensors not connected at the time. Sensor alert settings can be viewed, individual sensors can be navigated to directly, and sensors can be removed from the group. Machine group name, description, and location are editable. Machine groups can be deleted with a confirmation step. User Accounts allows viewing, editing, and deleting user accounts. Settings includes Email Configuration, Gateway controls, MQTT Setup, Modbus Setup, and Software Update. Email Configuration sets up a corporate SMTP server for alert emails and password recovery. Without email configuration, password recovery is unavailable. Email alerts are toggled on, SMTP fields are filled in, and the configuration can be saved, tested, or cleared. A successful or failed test message displays at the top of the screen. Gateway options include Reset Configuration to factory settings, System Reboot (retains current settings), and Wireless Scanning Reboot (restarts the BLE controller software without rebooting the gateway). MQTT Setup allows configuring an MQTT integration by filling in all required fields. Configuration can be exported as a JSON file or imported from a JSON file. A configuration template is downloadable. Connection options include Connect, Save Only, and Test Connection. A failed connection displays a message. MQTT documentation covers Publish Topics, Subscribe Topics, and Additional Info, with expandable topic details. Modbus Setup enables a Modbus integration via a toggle and required configuration fields. Software Update shows available firmware updates by sensor type and gateway. Updates Available is indicated next to the relevant product image, and firmware files can be downloaded. To log out, click the account name in the upper right corner and select Log Out.